I went to a friend’s Fourth of July party this year, but I mistakenly thought the 4th was on a Thursday and not a Friday. So when I asked about when to arrive on Thursday, my host corrected me and said the 4th was on Friday. With my typical comedic alacrity, I immediately looked for an opportunity to turn this into a joke. I checked Google, and found that there is one country with an independence day on July 3rd - Belarus. I informed my host that I was under the impression that we were celebrating Belarusian independence, thanked them for correcting my mistake, and committed to bringing an American dish.
But this got me thinking - how many independence days overlap? What does the overall distribution of independence days look like (and is it much different from what we would expect if independence days were distributed at random)?
I’m not exactly sure what you, the reader, will get out of this analysis, but I figured since I was so interested in finding the answer to these questions, I would, like a good scientist, share my results with the world.
On the Number of Independence Days, and Their Distribution.
Most of the research and data for this article is based on the Wikipedia pages of independence days and national days (they are separate). The difference is that an “independence day” is one where, well, the country became independent from someone else; a national day is celebrated by countries that I guess are really into being themselves. Some countries have both. For the purposes of this analysis, I’m counting all countries that have either an independence day or a national day (or both) as contributing +1 sample size to the dataset. (Keep this assumption in mind as you read, because a different methodology would likely lead to different results). In total, there are 201 independence/national days in the dataset (corresponding to 201 countries).
Sometimes, a country’s independence day is on a different day than their national day. Where this occurs, I generally set their one allotted day as the independence day. For countries that use a different calendar system, like Israel, I chose the earliest day of occurrence in the Gregorian calendar. (There may be a few countries where I was a bit sloppy in applying these rules consistently - I kind of came up with this system as I was putting the dataset together).
Here are some visualizations of the dataset I collated; the full dataset (a .csv file) is included in the accompanying repo.
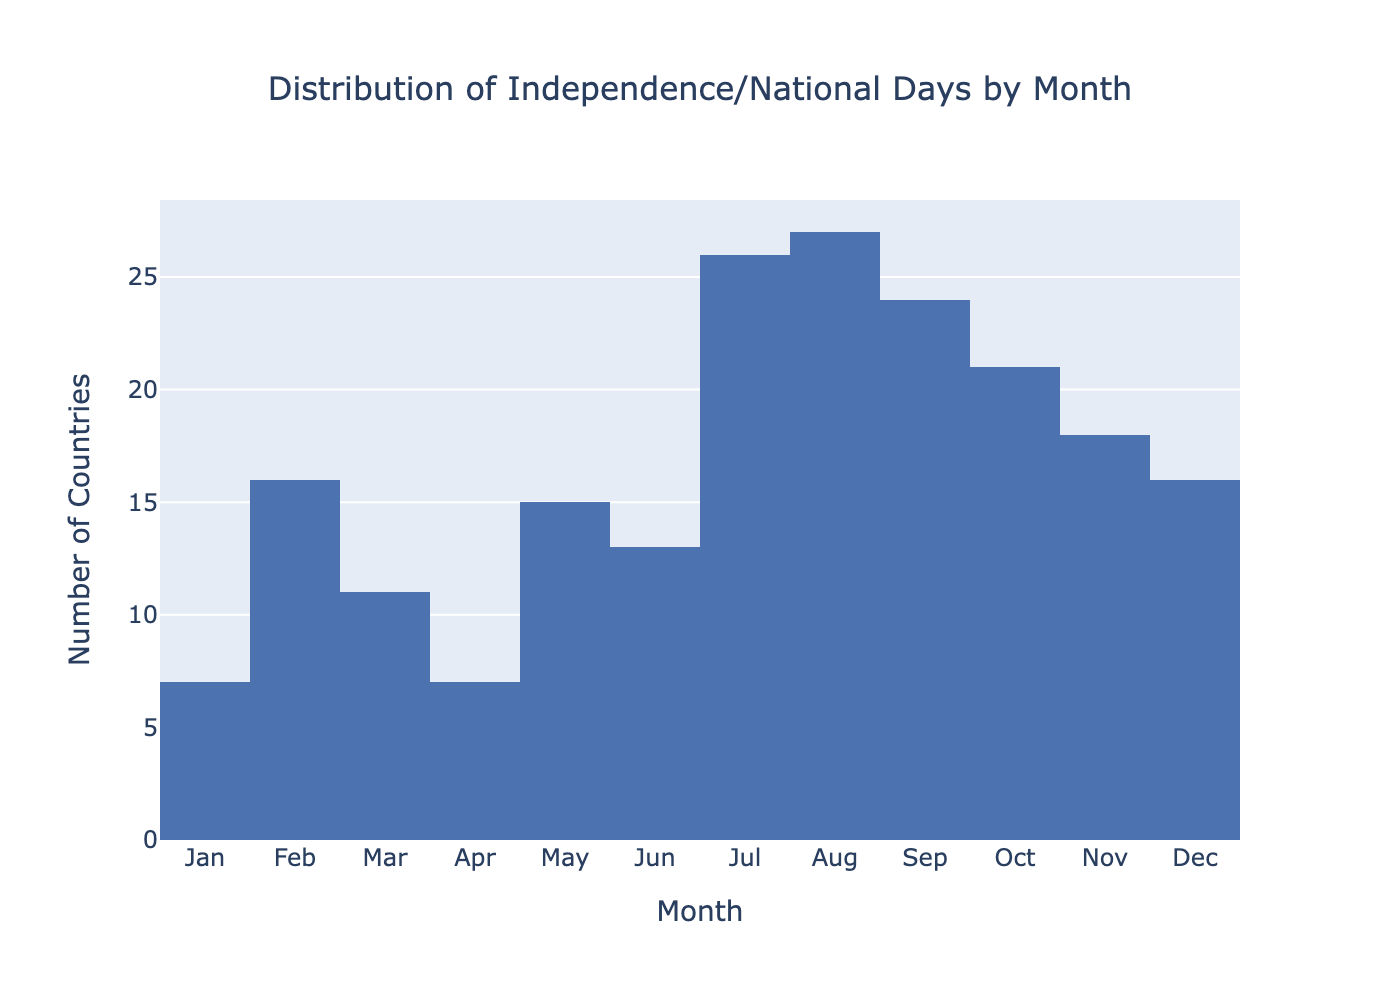
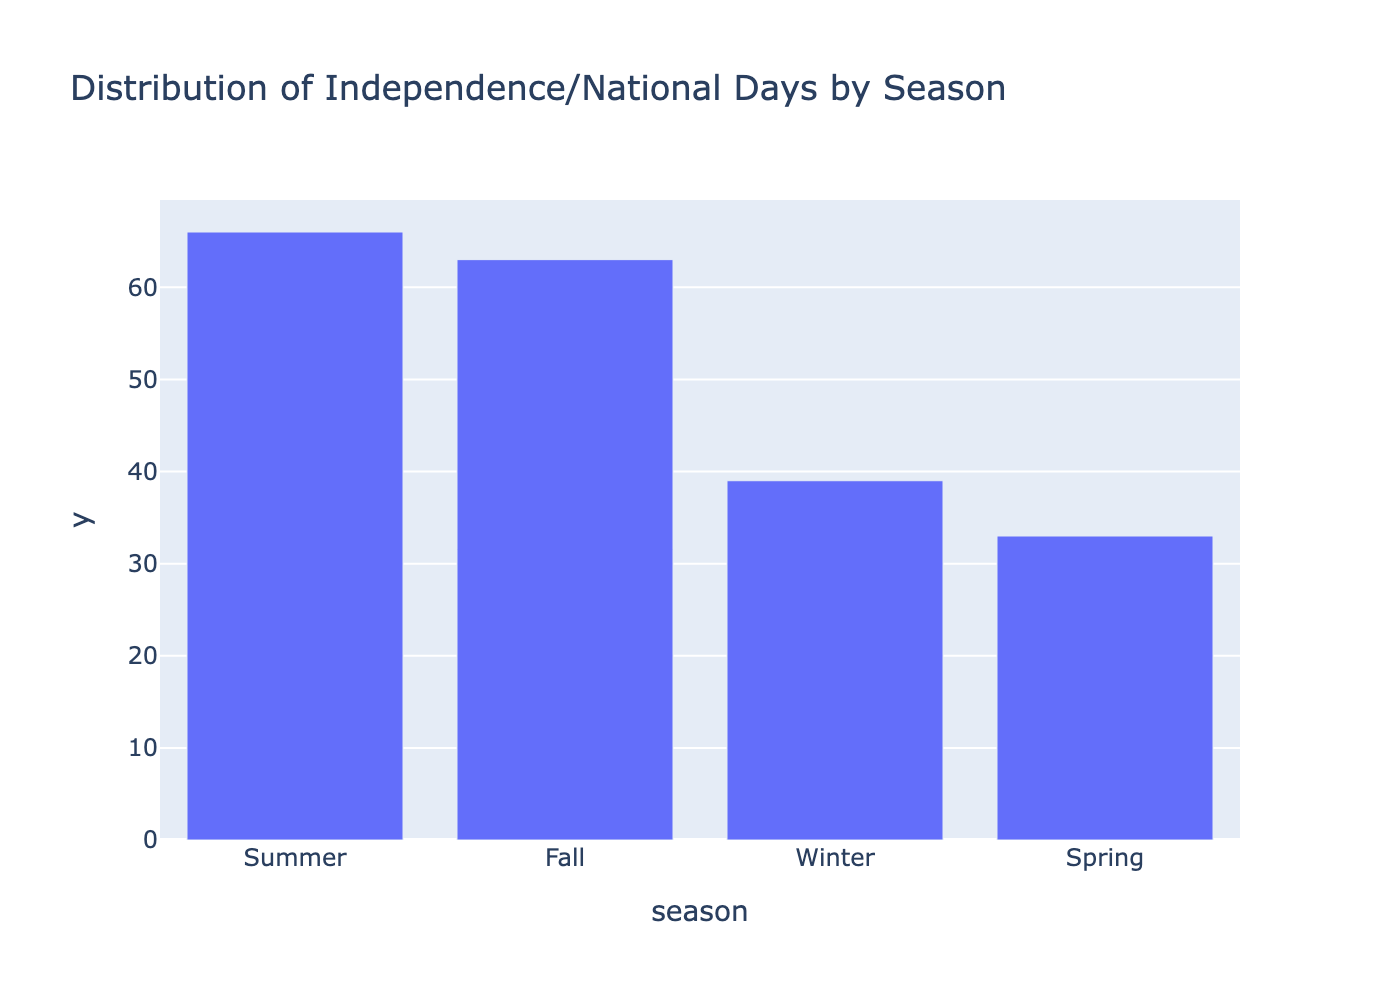
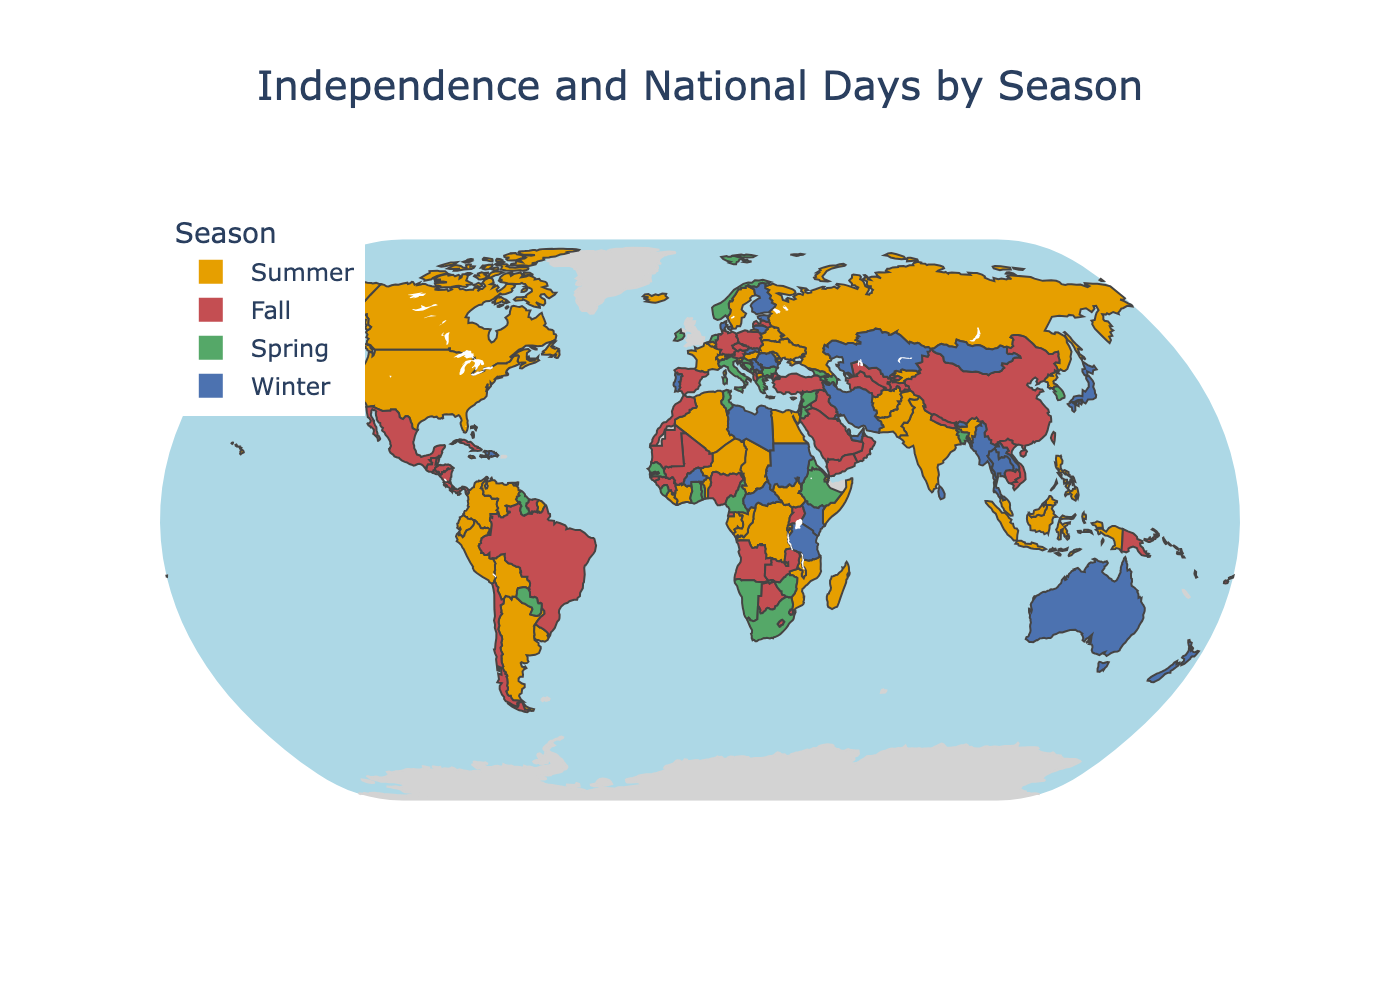
As I suspected, there are more national/independence days in the summer months. I’m not sure if my justification is correct, but I figured a) if you’re going to be either declaring or finishing a war for independence, the best times to fight wars are in the summer*, b) similarly big demonstrations or other events that lead to major regime change are more likely to happen in the summer*, and c) if you’re just looking for a day in your country’s history worth celebrating, might as well celebrate it when the weather’s nice. Regardless, the key takeaway, it looks like, is that the second half of the year is great for revolution (usurpers take note).
What Would We Expect If the Distribution was Random?
It’s hard to say that some given event or observation is random. There’s the tricky question of what random is in the first place: even something as stereotypically random as a roll of the dice is governed by precise, known physical laws that (if parameterized properly) could predict the roll with high accuracy. Then there’s the added question of how, mechanistically, the distribution of independence days could turn out to be random. Is there a plausible world where there is no connection between the dates of independence/national days? I gave a few reasons above why we should expect the distribution to not be random; in this sense, I’m using random in the sense of “unpredictable”. That’s not a great sense to use the term, though, because some things can be genuinely unpredictable (i.e., random), while other things can merely appear unpredictable (like the weather a month from now) because we are evaluating predictability on the basis of our current mathematical, computational, etc. tools.
Luckily, a probabilistic analysis sidesteps such epistemic worries. We just assume that it’s random (don’t care how) and go from there. To answer one of the motivating questions of this post - how many days of the year there’s an overlap in independence/national days - we will use a neat trick I learned in my probability class in college. Since we are interested in counting something, we introduce a counter function: for an independence/national day overlap of k, and a number of independence/national days I(d) for day d of the year, let
$$ n(d)= \begin{cases} 1 & I(d)=k \\[6pt] 0 & I(d) \neq k \end{cases} $$In other words, if the number of independence/national days on day d is equal to the given overlap, we assign that day a value of 1, and 0 otherwise. Thus, to get the expected number of overlaps, we take the expected sum of this counter function over all days of the year:
$$ \text{Expected overlaps}=E[\sum_{d=1}^{365}n(d)] $$(Yes, I’m assuming there are just 365 days in the year - that won’t affect our results much).
Because of linearity of expectation, we can chuck the expectation into the sum:
$$ \text{Expected overlaps}=\sum_{d=1}^{365}E[n(d)] $$This makes things a lot easier - now we can directly compute the expected number of overlaps of size k for a single day if we know what the distribution looks like. In this case, we select a binomial distribution because we’re dealing with a binary outcome (either an overlap of exactly k or not) and we’re assuming each day is an independent draw from this distribution. (We know from the empirical distribution that it isn’t, but again, we’re just having a bit of fun assuming that it is).
To calculate this expectation, I find it useful to transpose this situation into one that’s easier to visualize. Imagine you have n coins you need to toss into c containers. You could ask “What is the expected number of containers that will share exactly two coins?” That’s the same question as “What is the expected number of days that will share exactly two independence/national days?” And in the former case, we would answer the question by following the logic of a binomial random variable. Any given container (day) has a probability 1/n of receiving the next coin (independence/national day). So, in the language of binomial RVs, p = 1/365 and q = 1-p = 364/365. The number of trials (n) is the number of coins (independence/national days), which is 201 in my dataset. (That’s why having one celebration day for each country was important, so it could easily conform to the binomial model). Hence for an overlap of exactly 2,
$$E[n(d)]=1*p(\text{overlap}=2)+0*p(\text{overlap}\neq 2)$$ $$ \begin{aligned} p(\text{overlap}=2) &= \text{Binomial}\!\bigl(n=201,\;p=\tfrac{1}{365},\;k=2\bigr) \\[6pt] &\Rightarrow {201 \choose 2}\! \left(\frac{1}{365}\right)^2 \left(\frac{364}{365}\right)^{199} \;\approx\; 0.087 \end{aligned} $$ $$E[n(d)]=0.087 \Rightarrow \text{Expected overlaps of exactly 2}=365*0.087 \approx 32$$The general formula for calculating the expected overlap of size k is
$$365*{201\choose k} \left( \frac{1}{365} \right)^{k}\left( \frac{364}{365} \right)^{201-k}$$Below is a graph displaying the expected overlaps of size k from k = 1 to 4. Note that an overlap of 1 is just the expected number of days with one independence/national day.
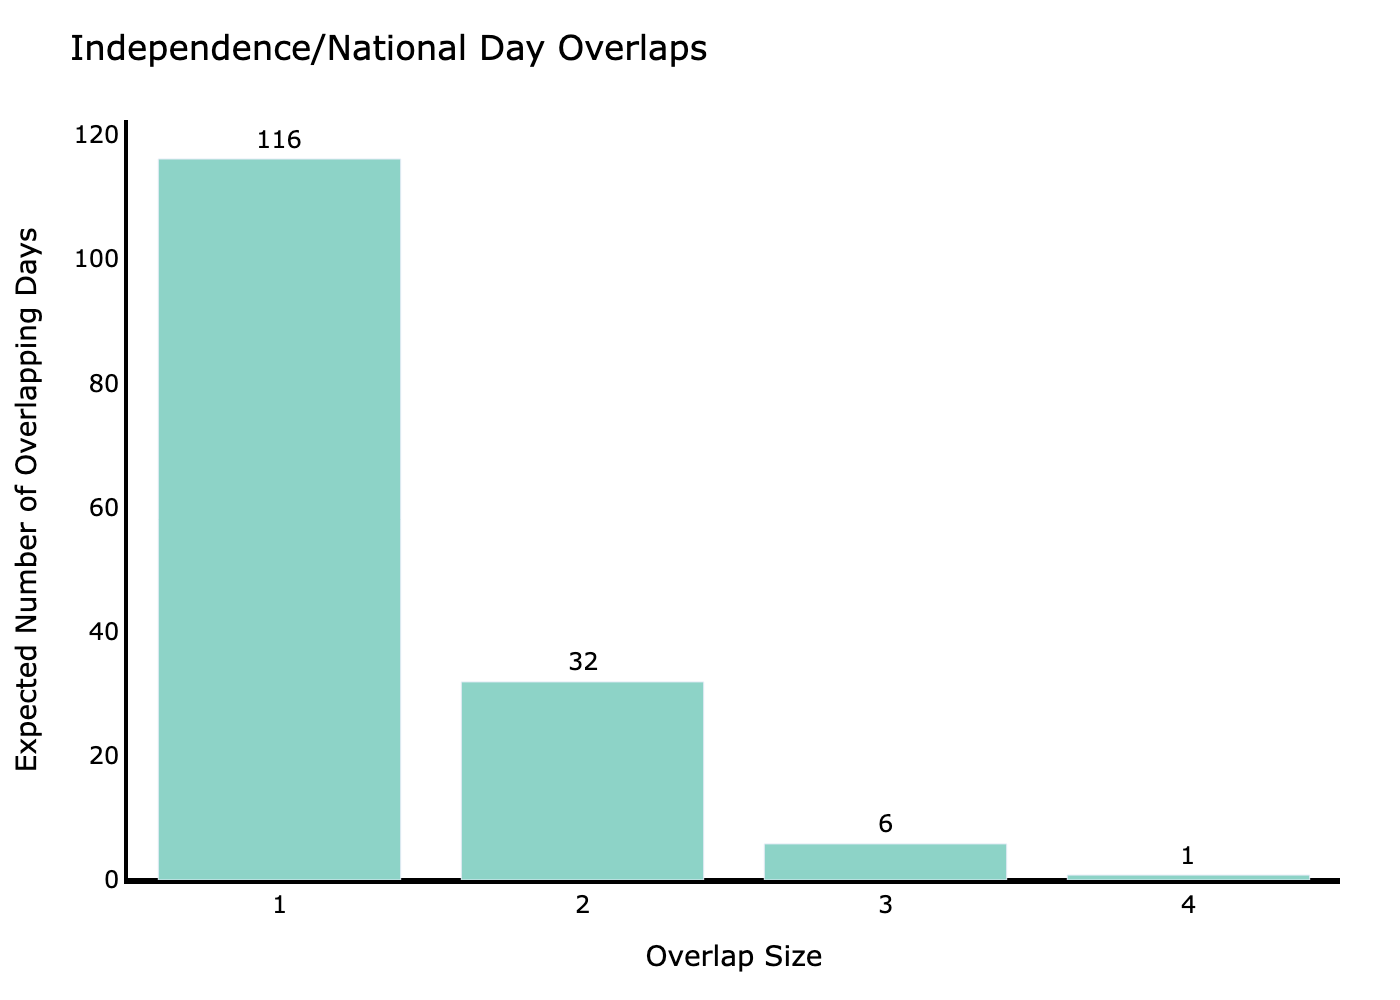
The number of days with k overlaps decreases quite rapidly; an overlap of 4 is only expected once.
Expectation vs. Reality
Finally, now that we have both the expected number of overlaps from the binomial distribution, and the empirical number from the first section, we can compare them to see how they match up. Theoretically, because the actual distribution is more clustered around the second half of the year, I would expect to see more overlaps (imagine if all of the independence/national days were squeezed into one or a couple months - there would be many overlaps of many sizes).
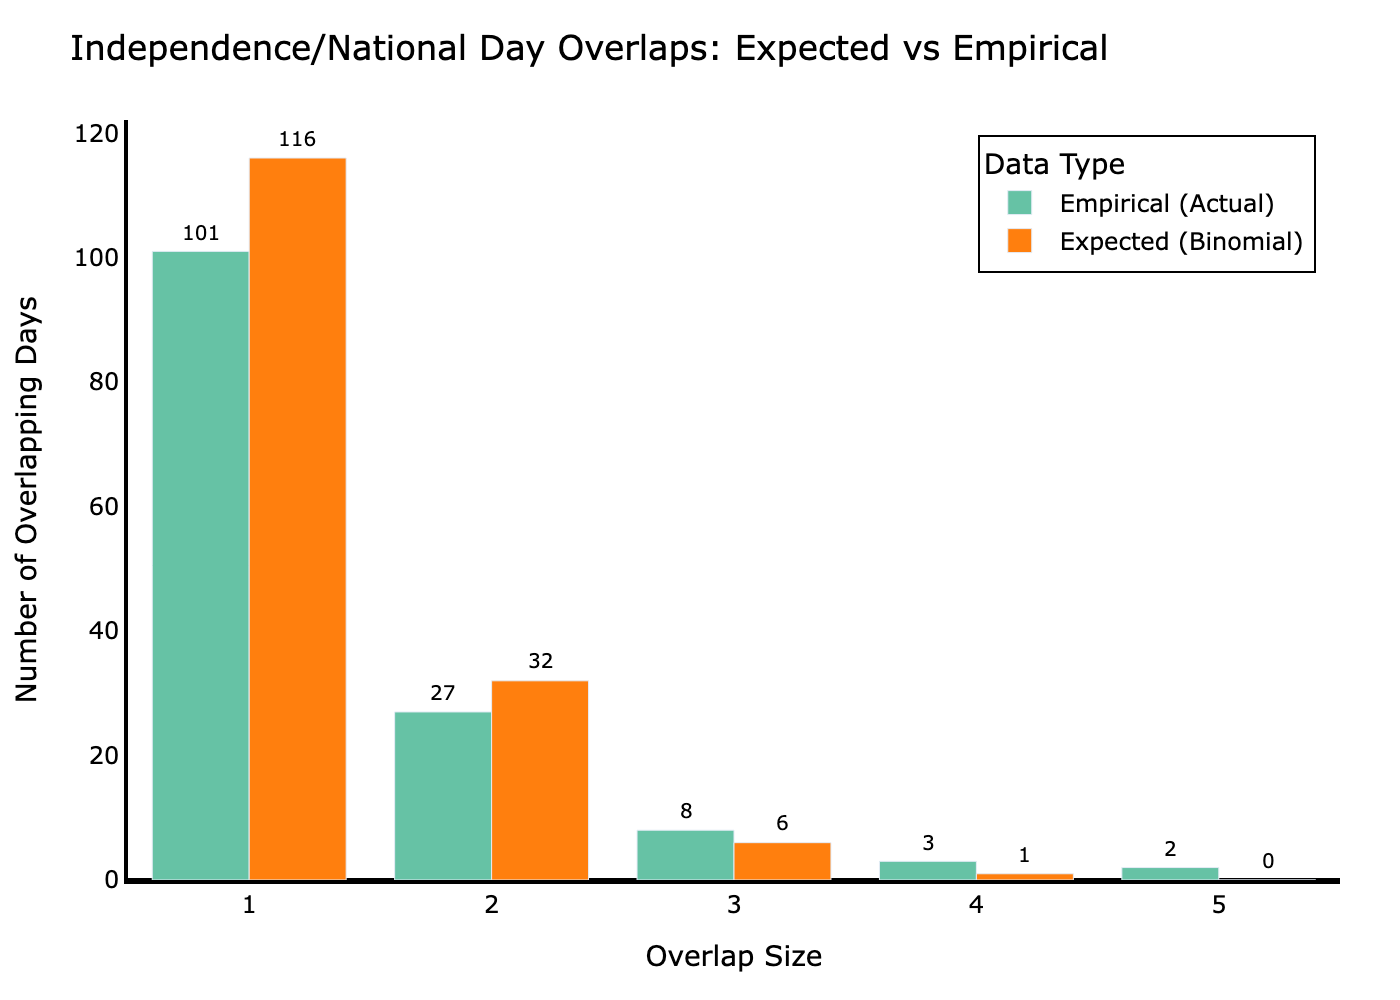
In reality, the picture is a bit more complicated. There are two days of the year with 5 independence/national days each - January 1st and September 15th.† The fact that the right tail of the empirical distribution is heavier makes a lot of sense to me - independences are often not independent events (ironically). There are several reasons why independence days can occur together; I give two examples in the footnote. The “cost” of having more co-occurring independence days than predicted by chance is less days of the year overall that have any independence days (“overlap” of 1) and less days with exactly 2. But it evens out overall - there are 40 days of the year that have any overlapping (k >= 2) independence days, and 39 such days predicted by the binomial distribution.
Well, I guess that’s all. Thanks for making it this far if you did, and if you are so inclined, check out the dataset. The results will probably change if you use a different methodology than the one I used, where I somewhat arbitrarily selected one celebration day for each country despite many countries having two (and sometimes more). Future research should explore the impact of methodology on the final results.
*I’m talking about summer in the Northern Hemisphere, which comprises the overwhelming majority of the world’s countries and therefore (if my explanation for why summer months are more dominant is correct) biases the occurrence of independence/national days to June-September. But it’s also the case that most Southern Hemisphere countries are pretty warm throughout the year anyway, so this might be less of a big deal for them.
†January 1st is a natural day for a country to be given its independence. The countries that celebrate independence on New Years’ Day are Haiti, Sudan, Czechia, and Slovakia. (Brunei became independent on January 1st, although they commemorate their independence on February 23rd because their first celebrations in 1984 were delayed until then). Taiwan and Cuba have national holidays on the 1st, but Taiwan’s actual National Day is celebrated on October 10, which is the date I use for the analysis. September 15th is when the Central American countries of Costa Rica, El Salvador, Guatemala, Honduras, and Nicaragua became independent from Spain in 1824.